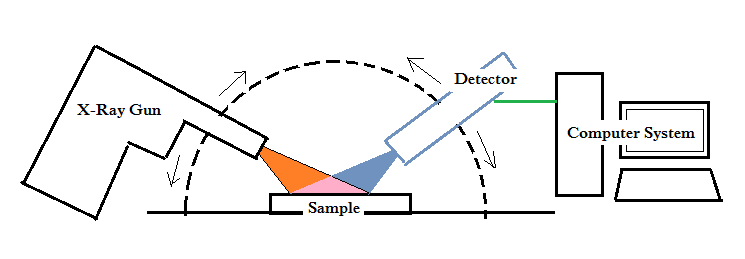
The X-Ray diffraction technique is very popular among scientists, not only because it allows studying the crystallography of materials, but because it also enhances the identification of materials with lot of information. The most significant components of an X-ray diffraction instrument (XRD) are the X-ray gun and the detector. The sample is located in-between the X-ray gun and the detector of the instrument where the X-ray gun moves in a synchronized semi-circular motion while keeping the sample stationary in the center position. When the X-ray gun shoots X-rays at the sample, the detector detects the scattered X-rays before the signals are directed to a computer system to make a graphical representation of the peaks. The collective curve represents the atomic structure of the sample.
Most of the time, the XRD anticipates powder samples, which is why it is called a powder diffraction technique. A powder sample is comprised of crystals, while each crystal contains regularly arranged atoms. We normally understand that the structure of an atom claims to have a nucleus in the center surrounded by orbiting electrons.Therefore, XRD deals with the atomic level of any material.
We know that X-rays are high energetic light with a synchronized sinusoidal pattern which makes repeated mono wave length. Since the wavelength could be used as a tool to measure the distance of atoms in a crystal, an effect called diffraction is used to measure the distance between atomic layers.
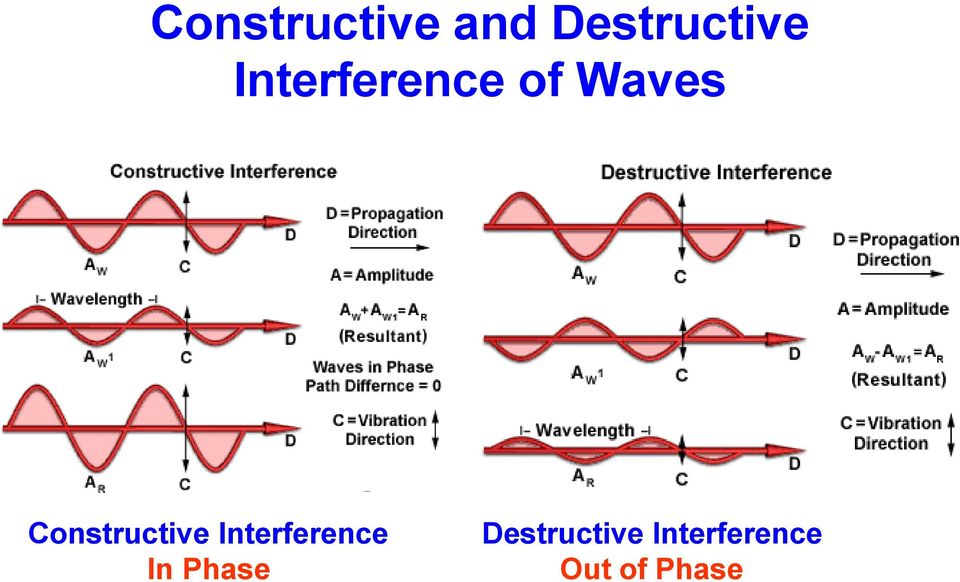
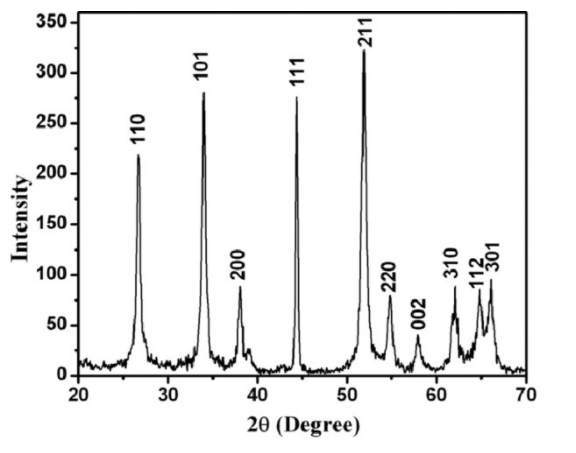
An amplified wave could be expected if the scattering X-rays align with each other (as shown in Figure 3), and this effect is called constructive interference. Destructive interference could be expected when X-ray waves are out of alignment so an output wave is not produced. That’s how peaks appear on the XRD curve due to constructive interference.
When X-rays hit atoms in a sample, the electrons of the atom absorb the energy. Though electrons occupy different energy states around them, these absorbed energies are not sufficient to break away electrons. Then the electrons start re-emitting that absorbed energy in the form of a new x-ray but almost with the same energy. This phenomenon is called elastic scattering.
Atoms in a gas or liquid do not have a proper order of arrangement, but a solid has a far more regular order in the arrangement of its atoms.
When we consider the arranged atoms of a solid, the smallest entity of a crystal lattice is called a unit cell. Unit cells exist in many types. But for easy understanding, let us consider the most primary of all, the one which has only eight atoms at its corners as depicted in figure 4 (a).
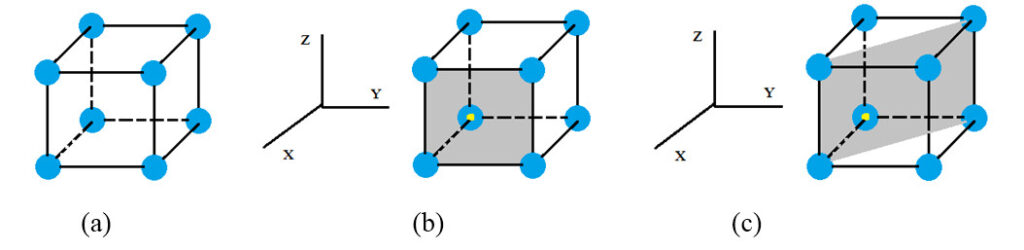
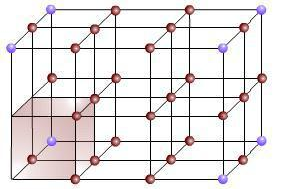
To represent the gray colour plane in figure (b) with respect to a reference plane of x,y,z on left while considering the yellow colour dot to be the origin, we can represent it as (1,0,0). The considered plane seems to only intersect with the x axis but remains infinite with z and y. That’s why we could represent it as (1,0,0) [infinite represented as zero]. Similarly, the figure (c) plane could be represented as (1,1,0) since it intersects with x and y whilst remaining infinite with z. These representations are called lattice parameters, and complicated structures are very difficult to explain without XRD software. Please note that this basic cell has neighbors around it in real situations (Figure 5), which means we can represent multiple cubic cells. As the basic cells multiply, parallel planes of the same lattice parameters also appear for parallel planes. Accordingly, we need to identify the “d” spacing of similar planes as well as the order of them. This is possible with XRD techniques.
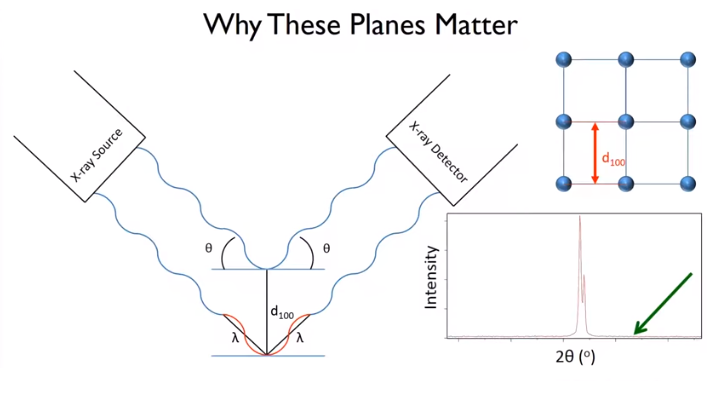
Let’s consider the (1,0,0) plane and the distance between the planes depicted in red to be the d spacing. Let X-rays of a certain wavelength shoot at the sample at an angle of. When it happens, the scattered X-ray is detected by the X-ray detector. Here, strong constructive amplifications are obtained by diffraction for specific angles. The angle between the incident beam and the scattered beam is 2. If the X-ray at the bottom path reaches the same time as the top path, to keep waves aligned, the bottom path should travel an additional distance, which is depicted by the red colour in Figure 6. It is considered as an integral multiplication of the used wave length.
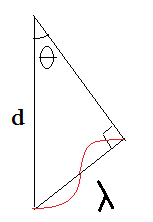
Let’s consider the triangle (Figure 7) extracted from Figure 6. From the geometry we can clearly get an equation for λ as λ = d {Sinϴ}. But If the X-ray at the bottom path to reach same time with the top path, the bottom path should travel an additional distance of 2λ. That’s how Bragg’s equation came in to light as
nλ = 2d Sinϴ
which is used to calculate d spacing. I must remind you again that construction interference should appear when the two wave paths have the same alignment to furnish a corresponding peak. If the angle ϴ is increased, then the two path waves might not align and destructive interference may appear, resulting in the refusal of a peak. So there is a specific angle or theta value in which we get the corresponding peak. Sir William Henry and his son, William Lawrence Bragg won the Nobel price in 1915 for discovering Bragg’s law for analyzing crystal structures with XRD.
Phase quantification utilizes peak intensities. From the half width of full maximum (FWHM) we can achieve the particle size of a crystal from XRD by using Scherrer’s equation: D=Kλ/(β cos θ). It is regarded that for the cubic crystal structure, K =0.94, λ is wavelength of the X-ray and θ is the Bragg’s angle. d equals the full width at half the maximum intensity of the peak.
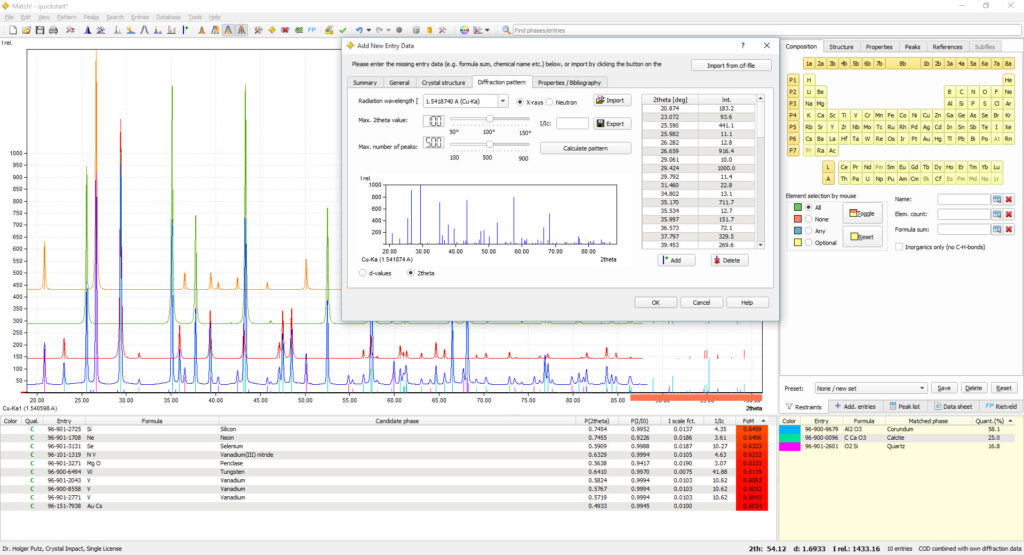
Modern XRDs with sophisticated software and data libraries give rise to the identification of crystallized materials.
XRD is used to test single crystal epitaxial thin films and polycrystalline mixtures of powders as well as to identify amorphous materials. It is used to track adulteration, to track rock formation and geological information as well as used heavily in pharmacology, ect.
XRD testing is a non-destructive test method used to analyze the structure of crystalline materials. XRD analyzers study the crystal structure, identify the crystalline phases present in a material, and thereby it reveals the chemical composition.

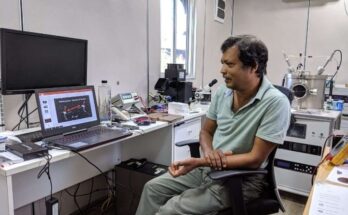
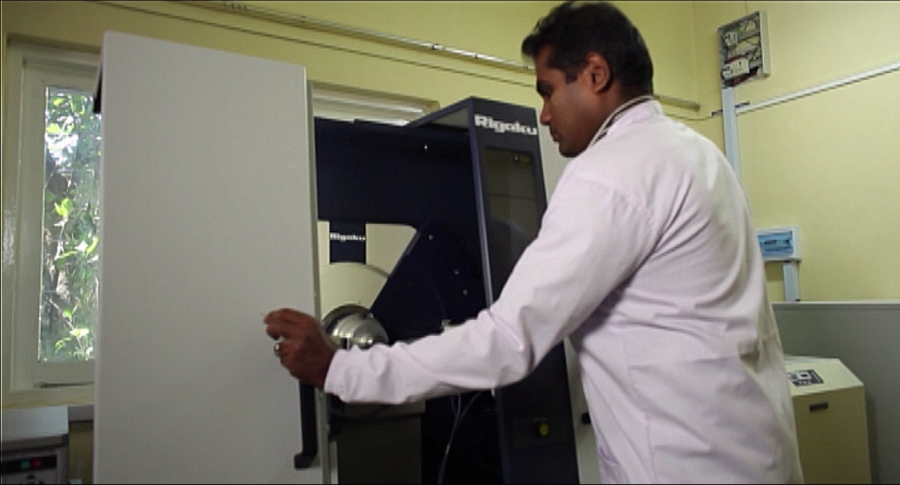
In Sri Lanka, the material technology section of the Industrial Technology Institute Colombo7 is armored with a sophisticated XRD instrument worth a few billions with the additional advantage of connecting a heat element. This enables one to study the crystallography of a sample in the presence of temperature variance.
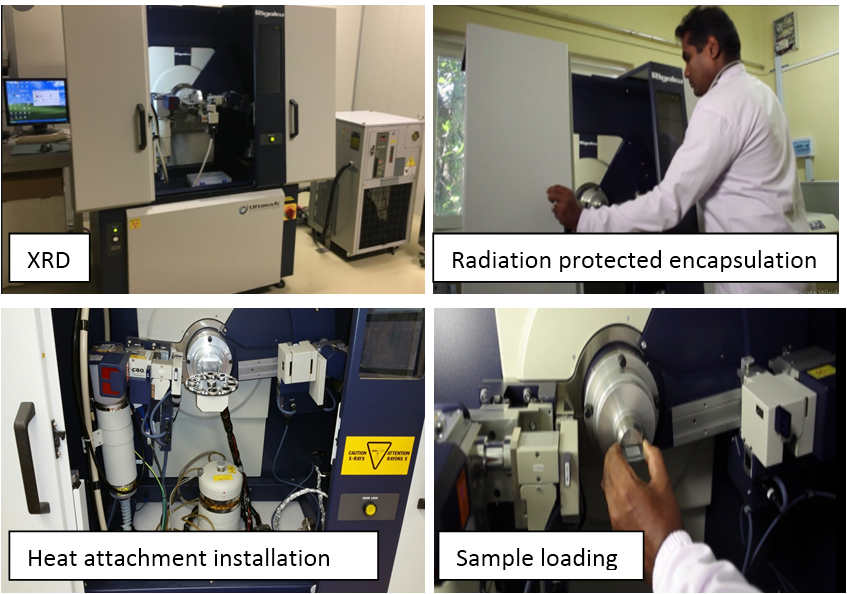
ITI’s XRD claims to be one of the most sophisticated pieces of analytical instrumentation with such a capacity in the island. Thanks to the non ambient XRD, it is now possible to get lattice parameters with respect to varying temperatures. This feature could be used for many types of analysis including the domains of mineralogy, ceramics, geology, and pharmaceuticals, archeology, etc.
This XRD at ITI also being used mostly to material identification and quantification applications (crystalline and polycrystalline materials), use to analyze composition of mixtures, to analyze impurities, tracking adulterants and filler identification, characterizing coatings, providing real time phase transition analysis, while stepping to the potential areas including Soil & Minerals, Ceramic, Cement & Asbestos, Pharmaceuticals, Agrochemicals, Cosmetics, Composites, inorganic materials and used extensively for research purposes and regularity purposes.
If you make a specific composite or have a developed product by someone else, it is worth testing in order to make sure your material is what you believe it to be or not because those cannot be identified with the naked eye unless you have access to a XRD.