Stars, those celestial objects that light up our night sky, have captivated human imagination for centuries. Their colors and surface temperatures are not merely aesthetic; they provide invaluable insights into the mysteries of the universe. This exploration embarks on a cosmic journey to understand the profound interplay between the color and surface temperature of stars. Wien’s Law is a mathematical marvel employed to explain this relationship, and the roadmap map of the Hertzsprung-Russell (H-R) diagram is a guiding light in astronomy navigated to decipher the secrets of the stars’ characteristics.
Stars, those luminous celestial objects that adorn the night sky, span a spectrum of colors from fiery red to icy blue. But this colorful display is not mere happenstance; it’s intricately connected to a star’s surface temperature. The connection between a star’s surface temperature and the color it radiates is a captivating tale of celestial physics.
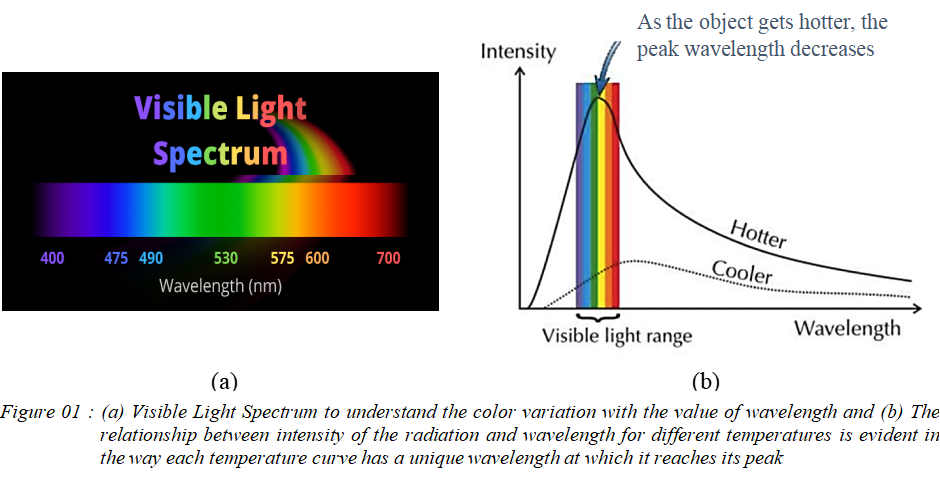
Wien’s Law, a mathematical formula formulated by the German physicist Wilhelm Wien, is the key to understanding the relationship between a star’s color and its surface temperature. This law elegantly illustrates how a star’s surface temperature dictates the color it emanates. Wien’s Law states that the wavelength of light emitted by a star is inversely proportional to its temperature. The higher the star’s surface temperature, like our sun, the shorter the wavelength of light it emits, shifting towards the bluer end of the visible spectrum. Conversely, cooler stars emit longer wavelengths of light, leaning towards the red end of the spectrum (Figure 01). This fundamental principle provides astronomers with a powerful tool to estimate a star’s temperature by simply observing its color.
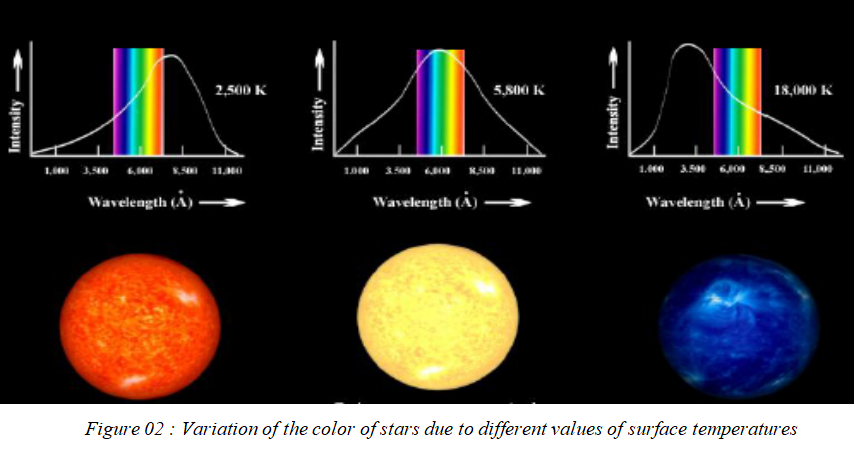
This relationship is intrinsic to the very essence of stars. Consider our sun, an average yellow star. It glows at a surface temperature of about 5,700 degrees Celsius (10300 degrees Fahrenheit), causing it to emit a warm, and yellowish light. Contrast this with a scorching blue giant, with surface temperatures reaching tens of thousands of degrees Celsius, resulting in a deep blue radiance. Conversely, the dim, cool red dwarfs, with surface temperatures just a few thousand degrees Celsius, display a reddish hue (Figure 02).
To fully grasp the implications of Wien’s Law and the color-temperature relationship, it is important to turn on the Hertzsprung – Russell diagram, a celestial masterpiece created by the Danish astronomer Ejnar Hertzsprung and the American astronomer Henry Norris Russell in the early 20th century. The Hertzsprung – Russell diagram, often referred to as the H-R Diagram. The H-R Diagram provides a visual roadmap for understanding stars based on their surface temperature, luminosity (brightness), and evolutionary stages. H-R Diagram reveals distinct groupings of stars, such as the main sequence, giants, and supergiants, which correspond to specific stages in a star’s life cycle. One prominent feature is the main sequence. It is a diagonal band stretching from the top left (comprising hot, luminous blue giants) to the bottom right (inhabited by cool, dim red dwarfs). Stars spend the majority of their lives in this band, fusing hydrogen into helium, which is what powers stars like our sun. The main sequence represents a stable phase of a star’s life. Above and below the main sequence lie additional chapters in a star’s life story. Supergiants and giants, residing above the main sequence, are massive, brilliant stars in various stages of evolution. They are the celebrities of the cosmic stage, casting a dazzling radiance. Below the main sequence are the white dwarfs, dim remnants of stars that have completed their stellar journey. (Figure 03)
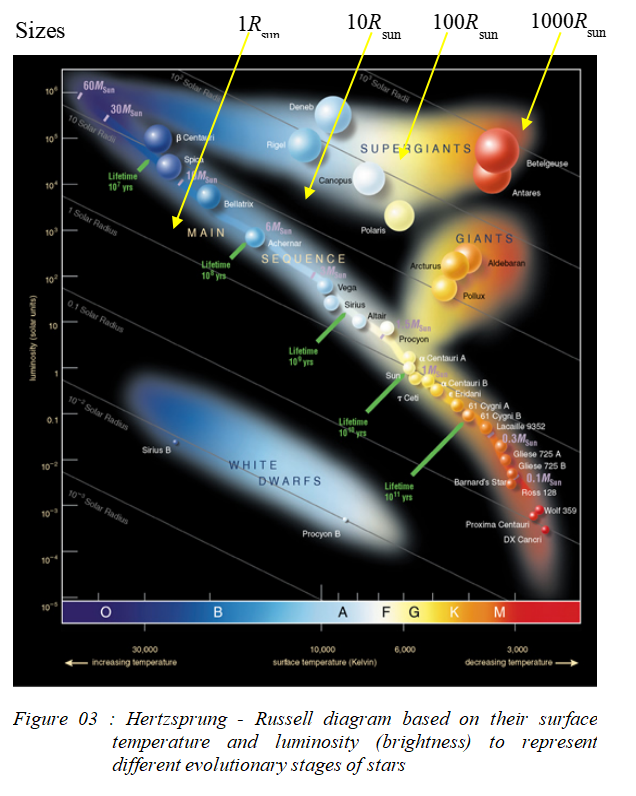
By plotting stars on the H-R Diagram, astronomers can decipher their evolutionary paths and predict their future. The relationship between star color, surface temperature, and the H-R Diagram has opened up a myriad of research fields as well as it allows us to unveil the cosmic mysteries that shroud the universe. Astrophysicists study these relationships to understand star formation, evolution, and death. The H-R Diagram is paramount in unraveling the intricacies of a star’s lifecycle. Through this diagram, scientists can discern a star’s age, size, and ultimate destiny. The knowledge of stellar evolution forms the foundation for our understanding of the cosmos. Also, when examining exoplanets, the color and surface temperature of their parent stars play a pivotal role. This information aids scientists in assessing the habitability of these distant worlds, paving the way for the search for extraterrestrial life. Additionally, by analyzing the colors and surface temperatures of stars within a galaxy, astronomers can classify and understand different types of galaxies. For instance, elliptical galaxies primarily comprise older, redder stars, while spiral
galaxies host a blend of hot, young stars and cooler, older ones. Especially spectroscopy is a fundamental technique in astronomy, and it is reliant on the star’s color-temperature relationship. It allows astronomers to probe the chemical composition, temperature, and velocity of stars and galaxies, offering insights into the composition of celestial bodies far beyond our solar system. In conclusion, the cosmic connection between star color, surface temperature, and the Hertzsprung – Russell diagram has revolutionized our understanding of the universe. It’s a testament to the beauty and complexity of the cosmos, where color is not just a matter of aesthetics but a window into the inner workings of the stars.
References:
- Cenadelli, D., Potenza, M., & Zeni, M. (2012). Stellar temperatures by Wien’s law: Not so simple. American Journal of Physics, 80(5), 391–398. doi:10.1119/1.3699958
- Marr, J. M., & Wilkin, F. P. (2012). A better presentation of Planck’s radiation law. American Journal of Physics, 80(5), 399–405. doi:10.1119/1.3696974
- Airey, J., & Eriksson, U. (2019). Unpacking the Hertzsprung-Russell Diagram: A Social Semiotic Analysis of the Disciplinary and Pedagogical Affordances of a Central Resource in Astronomy. Designs for Learning, 11(1), 99-107. doi: 10.16993/dfl.137
About the Author Ms. Dinesha Dharmathilaka is a Lecturer at the Department of Physical Sciences and Technology, Sabaragamuwa University of Sri Lanka (SUSL). She holds a B.Sc. (Special) Degree in Applied Physics. Her academic and research interests focus on applied physics, contributing significantly to the advancement of knowledge in this field. Ms. Dharmathilaka is dedicated to both teaching and research, playing a pivotal role in shaping the future of her students while also engaging in impactful scientific inquiry. |